Introduction: The Phenomenon of Commodity Price Bubbles in the United States

Commodity markets serve as the backbone of the U.S. economy, influencing everything from household grocery bills to industrial manufacturing costs. Whether it’s crude oil powering transportation networks or corn feeding livestock and biofuels, commodities are deeply woven into the fabric of American life. Yet these markets aren’t immune to bouts of irrational exuberance-periods when prices surge far beyond their real-world value, creating what economists call commodity price bubbles. As we navigate 2025, investors, policymakers, and everyday consumers must stay alert to these dynamics. With inflation still a concern and global supply chains under pressure, understanding how and why bubbles form is more relevant than ever in the U.S. financial landscape.
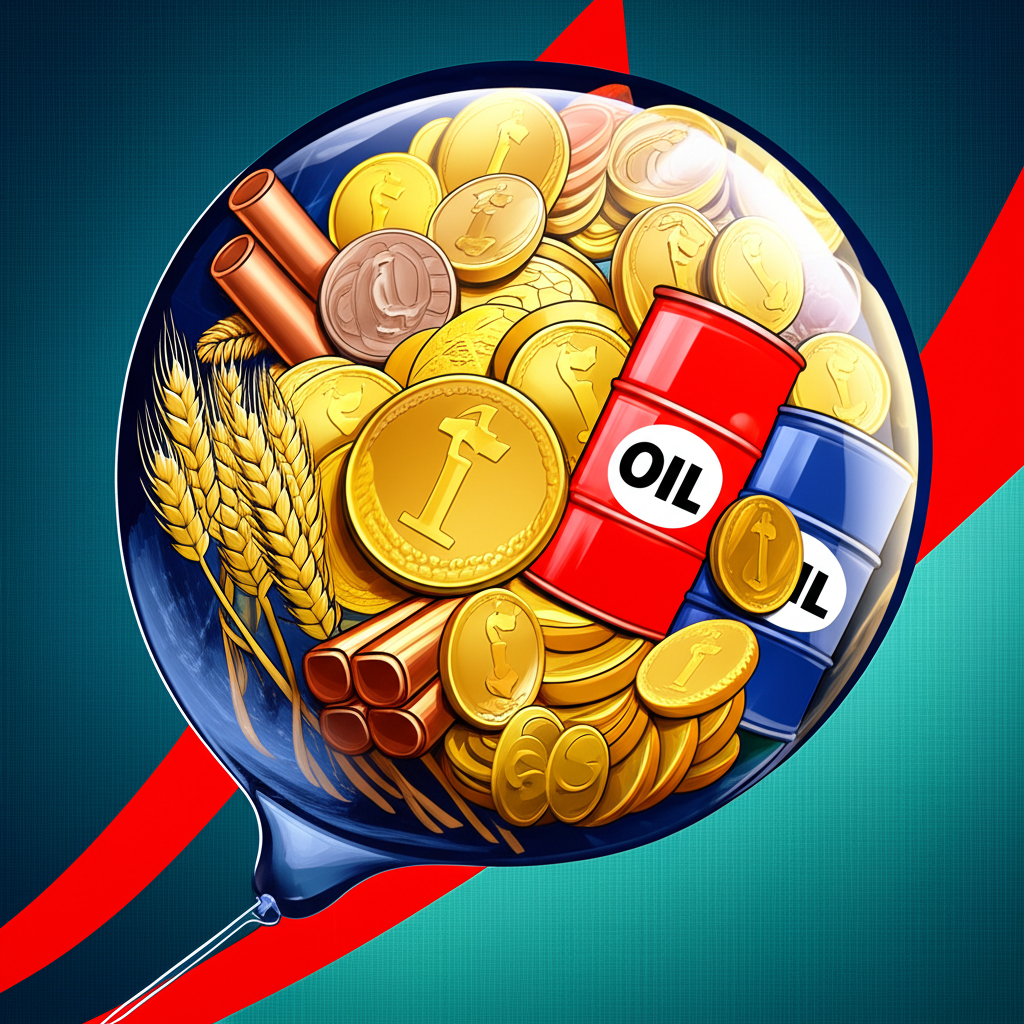
Defining Commodity Price Bubbles: An American Perspective
A commodity price bubble occurs when the market value of raw materials-like oil, gold, copper, or agricultural staples-skyrockets not because of real shifts in supply and demand, but due to speculation, momentum trading, and investor psychology. Unlike normal price swings driven by harvest reports or geopolitical events, bubbles reflect a dangerous disconnect between price and intrinsic value. In the United States, where commodities directly affect production costs, consumer prices, and monetary policy decisions, such distortions can ripple across entire sectors. When gasoline hits $5 a gallon not because refineries are down, but because traders are piling in en masse, that’s a red flag. These episodes aren’t just Wall Street drama-they influence everything from supermarket receipts to Federal Reserve rate hikes.
Why Commodity Bubbles Matter for US Investors in 2025
For American investors, recognizing the signs of a bubble isn’t academic-it’s financial self-defense. While rising prices can deliver short-term windfalls, especially in leveraged futures positions, the collapse that follows often wipes out gains and more. The aftermath typically includes heightened inflation, tighter Fed policy, and potential recessions-all of which impact stock markets, bond yields, and retirement portfolios. Consider this: surging oil prices feed directly into transportation and manufacturing costs, pushing up CPI and giving the Federal Reserve justification to keep interest rates elevated. That, in turn, pressures equities and real estate. Moreover, U.S. industries reliant on stable input costs-such as airlines, agriculture, and manufacturing-face squeezed margins when commodity prices run hot. Being able to spot early warning signals gives investors a critical edge in protecting capital and positioning for what comes next.
The Anatomy of a Commodity Price Bubble
Understanding how commodity bubbles evolve helps investors separate sustainable trends from speculative mania. These events don’t happen overnight; they unfold in stages shaped by human behavior, financial incentives, and macroeconomic conditions unique to the U.S. market structure.
The Five Stages of a Bubble: From Displacement to Burst
Market bubbles, including those in commodities, tend to follow a predictable lifecycle first identified by economist Hyman Minsky and later refined by analysts at institutions like Investopedia. This five-stage model provides a clear framework for spotting trouble ahead:
- Displacement: A new catalyst-such as a technological breakthrough (e.g., EV battery demand), a supply shock (like war in the Middle East), or a major policy shift (e.g., green energy mandates)-creates excitement about future demand. Early investors begin accumulating positions based on long-term outlooks.
- Credit Expansion: As prices rise, lenders become more willing to finance commodity trades. Margin accounts swell, futures positions grow larger, and cheap credit amplifies buying power. In the U.S., low interest rates or Fed liquidity programs often fuel this phase.
- Euphoria: Prices accelerate rapidly. Media coverage intensifies, retail investors rush in fearing they’ll miss out, and rational analysis gives way to herd behavior. At this point, price-to-value ratios become extreme, and fundamentals are ignored.
- Critical Stage / Profit-Taking: Savvy traders and institutional players start exiting positions. Trading volumes may remain high, but price momentum begins to stall. Whispers of overvaluation grow louder, though public sentiment remains bullish.
- Panic / Burst: A triggering event-a weaker-than-expected jobs report, a surprise Fed announcement, or a supply rebound-sparks a reversal. Leverage works in reverse: margin calls force liquidations, selling begets more selling, and prices collapse. The bubble bursts, often wiping out years of gains in weeks.
Speculation vs. Fundamentals: Driving Forces in US Commodity Markets

At the core of every bubble is a tug-of-war between supply-and-demand realities and speculative fervor. In U.S. commodity markets, both forces carry weight-but only fundamentals sustain long-term price levels.
- Fundamentals: These include measurable factors like global inventories, production capacity, weather patterns affecting crops, mining output, and geopolitical risks. For example, a drought in the Midwest drives up corn prices; sanctions on Russian oil tighten global supply. In the U.S., domestic shale production, Strategic Petroleum Reserve releases, and agricultural export demand are key variables. The strength of the dollar also plays a major role-since most commodities are priced in USD, a stronger greenback tends to suppress prices.
- Speculation: This is trading based on anticipated price movement rather than economic utility. Hedge funds, algorithmic traders, and even retail investors can amplify trends through futures contracts and leveraged ETFs. Excessive speculation often inflates prices beyond what the physical market supports. The Federal Reserve’s monetary stance-especially interest rates and quantitative easing-can encourage speculative activity by increasing liquidity and lowering the opportunity cost of holding non-yielding assets like metals or grains.
Historical Commodity Price Bubbles: Lessons for the United States
Past bubbles offer sobering lessons about how quickly optimism can turn to crisis-particularly in the interconnected U.S. economy. By studying previous episodes, investors gain perspective on what drives runaway prices and how policy responses shape recovery.
Notable Commodity Bubbles Through History
Though Tulip Mania in 17th-century Holland remains the classic example of speculative mania, modern commodity bubbles have had far greater consequences for American markets:
- Oil Price Spikes (1970s, 2000s): The 1973 Arab oil embargo sent crude prices quadrupling, triggering stagflation in the U.S. and contributing to a deep recession. Decades later, oil surged toward $150 per barrel in 2008, driven by booming Chinese demand, tight supply, and speculative inflows. When the financial crisis hit, demand evaporated and prices collapsed by over 70%, devastating energy companies and pension funds alike.
- Precious Metals Bubbles (Gold, 1979-1980, 2011): Fearing inflation and political instability, investors drove gold above $800/ounce in 1980-equivalent to roughly $3,000 today. After peaking, it entered a 20-year bear market. A similar pattern emerged post-2008: gold climbed to nearly $1,900/ounce by 2011 amid QE and eurozone fears, only to fall back below $1,100 by 2015.
- Agricultural Commodities (2007-2008, 2010-2012): Global food prices spiked due to droughts, rising biofuel mandates (especially U.S. ethanol policy), and speculative trading in grain futures. Wheat, rice, and corn prices doubled in some cases, sparking food riots abroad and pushing U.S. grocery inflation sharply higher.
A Federal Reserve paper on asset price bubbles details how speculative episodes can destabilize broader financial systems, particularly when leverage is involved.
Analyzing Past Bursts and Their Impact on the US Economy
When commodity bubbles burst, the fallout often extends well beyond the trading floor. In the U.S., historical collapses have triggered recessions, policy overhauls, and shifts in consumer behavior.
- Economic Downturns: The oil shocks of the 1970s and 2008 both preceded or coincided with U.S. recessions. High energy costs squeezed household budgets and increased operating expenses for businesses, slowing overall economic activity.
- Inflationary and Deflationary Pressures: Rising commodity prices feed CPI, prompting the Fed to tighten policy. Conversely, a sudden price collapse-like the 2014-2016 oil bust-can lead to disinflation, hurting energy-sector employment and debt-laden producers.
- Regulatory Reforms: After the 2008 crisis, regulators scrutinized speculative activity in commodity derivatives. The Commodity Futures Trading Commission (CFTC) expanded position limits and enhanced transparency in futures markets to reduce systemic risk.
| Commodity | Period of Bubble | Peak Price (Approx.) | Primary Drivers | Impact on US Economy | Resolution |
|---|---|---|---|---|---|
| Oil | 2000s – 2008 | $147/barrel (WTI) | Rising global demand, geopolitical tensions, speculative inflows | Contributed to 2008 recession, high energy costs | Global financial crisis, demand destruction |
| Gold | 2008 – 2011 | $1,900/ounce | Safe-haven demand, inflation fears, loose monetary policy | Increased cost of capital for some industries, investor flight to safety | Easing of global financial crisis, dollar strength |
| Agricultural (e.g., Corn) | 2007-2008, 2010-2012 | Highs of $7-8/bushel | Biofuel demand, adverse weather, speculative inflows | Food inflation, impact on US farmers and food industry | Increased supply, policy changes, market correction |
Identifying a Commodity Price Bubble in 2025
Spotting a bubble in real time is notoriously difficult-by design, most participants believe “this time is different.” However, experienced investors use a combination of quantitative signals and qualitative judgment to assess whether prices are on solid ground or floating on hype.
Key Indicators and Warning Signs for US Markets
The following red flags can help U.S. investors detect speculative excess before it’s too late:
- Price-to-Fundamental Divergence: If copper prices soar while global industrial production stagnates, or if wheat futures spike despite bumper harvests, it suggests speculation is driving the market.
- Surge in Margin Debt: A rapid rise in the use of borrowed money to finance commodity positions-especially in futures trading-indicates growing risk appetite and potential overleveraging.
- Media Hype and Retail Frenzy: Widespread headlines claiming “gold will hit $3,000” or “oil is going to $200” often accompany euphoric phases. Social media buzz and surging retail participation are additional clues.
- Extreme Sentiment Metrics: Investor surveys showing near-universal bullishness, or put/call ratios skewed heavily toward calls, suggest complacency and limited downside protection.
- Unusual Volume and Open Interest: Explosive growth in trading volume and open interest in commodity futures, especially without corresponding news, often reflects speculative momentum rather than commercial hedging.
Economic Models and Analytical Tools for US Investors
No single model predicts bubbles with certainty, but combining tools increases confidence in assessments:
- Fundamental Analysis: Review data from the U.S. Energy Information Administration (EIA), USDA crop reports, and CFTC Commitment of Traders (COT) reports. Track industrial output, inflation trends, and Fed policy signals.
- Technical Analysis: Use indicators like the Relative Strength Index (RSI), Moving Average Convergence Divergence (MACD), and Bollinger Bands to identify overbought conditions or parabolic price moves.
- Statistical Models: Some academic approaches, such as log-periodic power law models or deviation from historical price-to-inventory ratios, attempt to quantify bubble risk. While complex, they offer supplementary insights.
Are We in a Commodity Price Bubble Today? The 2025 US Outlook
As of 2025, U.S. commodity markets show signs of strain-but whether we’re in a full-blown bubble depends on the specific asset class and underlying drivers.
Current Commodity Market Dynamics in the United States
Multiple forces are shaping the landscape this year:
- Oil and Natural Gas: Geopolitical instability in the Middle East and Eastern Europe, coupled with U.S. energy transition policies, continues to create volatility. However, resilient domestic shale output and the Strategic Petroleum Reserve provide buffers against extreme spikes.
- Gold: Persistent inflation concerns, ongoing Federal Reserve rate decisions, and global uncertainty have kept gold in demand as a hedge. At around $2,300/ounce, some analysts question whether near-term gains are overextended.
- Copper and Industrial Metals: Demand from electric vehicles, renewable infrastructure, and AI data centers is strong. But concerns about slowing Chinese growth and overcapacity in green tech manufacturing could dampen long-term pricing power.
- Agricultural Products: Climate volatility-floods, droughts, and shifting growing seasons-is disrupting yields. At the same time, U.S. ethanol policies and export demand keep grain markets tight.
- Monetary Policy: The Federal Reserve’s stance remains pivotal. Higher-for-longer rates increase the carrying cost of holding commodities and strengthen the dollar, both of which tend to weigh on prices.
The International Monetary Fund’s World Economic Outlook highlights ongoing global imbalances that could either stabilize or destabilize commodity flows in 2025.
Expert Opinions and Projections for the US in 2025
Market analysts are divided:
- Bullish voices argue that structural shifts-decarbonization, reshoring of manufacturing, and supply chain reconfiguration-are creating sustained demand for key commodities, justifying current valuations.
- Bearish analysts warn that easy credit conditions, passive ETF inflows, and speculative momentum could be inflating prices beyond fundamentals, especially in metals tied to green energy.
- Many economists stress that the Federal Reserve’s next moves will be decisive. A dovish pivot could reignite speculation; a hawkish hold may trigger profit-taking and correction.
Overall, the consensus suggests selective froth rather than a broad-based bubble. While certain sectors like lithium or rare earths show speculative heat, others remain grounded in supply constraints and real-world usage.
Strategies for Navigating Commodity Bubbles for US Investors
Successfully managing exposure to commodities in 2025 requires discipline, diversification, and access to reliable trading infrastructure-all within a regulatory-compliant framework.
Risk Management and Diversification Techniques
Smart investors don’t try to time the top-they prepare for volatility:
- Hedging with Derivatives: Producers and consumers use futures and options to lock in prices. Individual investors can use similar tools to cap downside risk on long or short positions.
- Diversify Across Asset Classes: Avoid overconcentration in any single commodity. Spread exposure across energy, metals, agriculture, and related equities or ETFs to reduce vulnerability.
- Stick to a Plan: Emotional trading leads to buying high and selling low. Define entry/exit rules in advance and use stop-loss orders to manage risk.
- Focus on Long-Term Value: While bubbles offer excitement, lasting wealth comes from understanding supply-demand dynamics and holding quality assets through cycles.
Investing in Commodities: Brokerage Options for US Traders in 2025
Choosing the right broker
Be First to Comment