
Understanding Commodity Market Cycles in the United States: A 2025 Outlook
Commodity markets are the backbone of the global economy, directly influencing everything from gasoline prices and grocery bills to manufacturing costs and inflation. For American investors, these markets aren’t just abstract financial concepts-they’re powerful forces that shape portfolio performance and economic stability. As we approach 2025, a complex mix of economic policy shifts, geopolitical uncertainty, and the accelerating energy transition is setting the stage for another pivotal chapter in the commodity cycle. Navigating this environment demands more than surface-level awareness; it requires a deep understanding of how these cycles operate, what drives them, and how U.S. investors can position themselves strategically to manage risk and seize opportunity.
The U.S. plays a dual role in global commodity markets-as one of the largest consumers and a top-tier producer, especially in energy and agriculture. This unique position means domestic investors feel both the price pressures and the profit potential more acutely than many of their international counterparts. From Texas oil fields to Midwest grain silos, commodity price movements ripple across industries and regions. In this guide, we’ll break down the mechanics of commodity cycles, examine their historical behavior, and deliver actionable insights tailored to the U.S. investment landscape in 2025 and beyond.
What Are Commodity Market Cycles? A U.S.-Focused Explanation

Commodity market cycles refer to the long-term, recurring patterns in raw material prices driven by the balance between supply and demand. Unlike short-term market swings caused by headlines or speculative trading, these cycles unfold over multiple years and reflect structural shifts in the global economy. For U.S. investors, recognizing where we are in the cycle-whether at the peak of a boom or the depths of a bust-can inform smarter decisions about asset allocation, risk exposure, and timing.
These cycles are most visible in sectors like energy (oil, natural gas), industrial and precious metals (copper, gold), and agricultural products (corn, soybeans, wheat). Because commodities are essential inputs for nearly every industry, their price trends influence inflation, corporate earnings, and monetary policy-making them a critical piece of the broader investment puzzle.
Defining Commodity Cycles: Beyond Daily Price Swings
A true commodity cycle is not about day-to-day volatility. It’s a multi-year rhythm shaped by the time it takes for supply to respond to changes in demand. When global growth accelerates-say, during a post-recession rebound-demand for raw materials climbs quickly. But bringing new oil wells online, opening a copper mine, or expanding farmland takes years and billions in capital. This lag creates a supply deficit, pushing prices higher in a sustained bull market.
Eventually, high prices incentivize new investment, and supply catches up. By then, economic growth may have cooled, demand slows, and prices begin to fall-marking the start of a bear market. This process can stretch over a decade or more, with prices swinging dramatically between highs and lows.
Key Characteristics: Duration, Volatility, and Uncertainty
Commodity cycles typically last between 5 and 20 years, though some stretch even longer. The amplitude-how high prices rise and how low they fall-can be extreme. For example, crude oil surged past $100 per barrel in 2008, crashed below $40 during the 2015 downturn, and spiked again above $120 in 2022. These swings offer outsized return potential but come with equally high risk.
Predictability remains elusive. While patterns repeat, the timing and triggers vary. No two cycles are identical, and external shocks-like wars, pandemics, or technological breakthroughs-can accelerate or derail the process. This unpredictability underscores the need for disciplined, research-driven strategies rather than speculative bets.
Commodity Cycles vs. Supercycles: What’s the Difference?
A standard commodity cycle reflects medium-term economic shifts. A supercycle, by contrast, is a rare, prolonged surge in prices lasting 20 to 30 years, driven by transformative global developments. The last major supercycle began in the early 2000s, fueled by China’s rapid industrialization, which created unprecedented demand for steel, cement, and energy.
Today, many economists argue we’re entering a new supercycle-not driven by industrialization, but by the global energy transition. The push for electric vehicles, renewable power, and grid modernization is spiking demand for lithium, cobalt, nickel, and copper. At the same time, underinvestment in traditional energy infrastructure could limit supply growth, creating a structural imbalance. For U.S. investors, this potential supercycle presents both a macroeconomic shift and a strategic opportunity in “new economy” commodities.
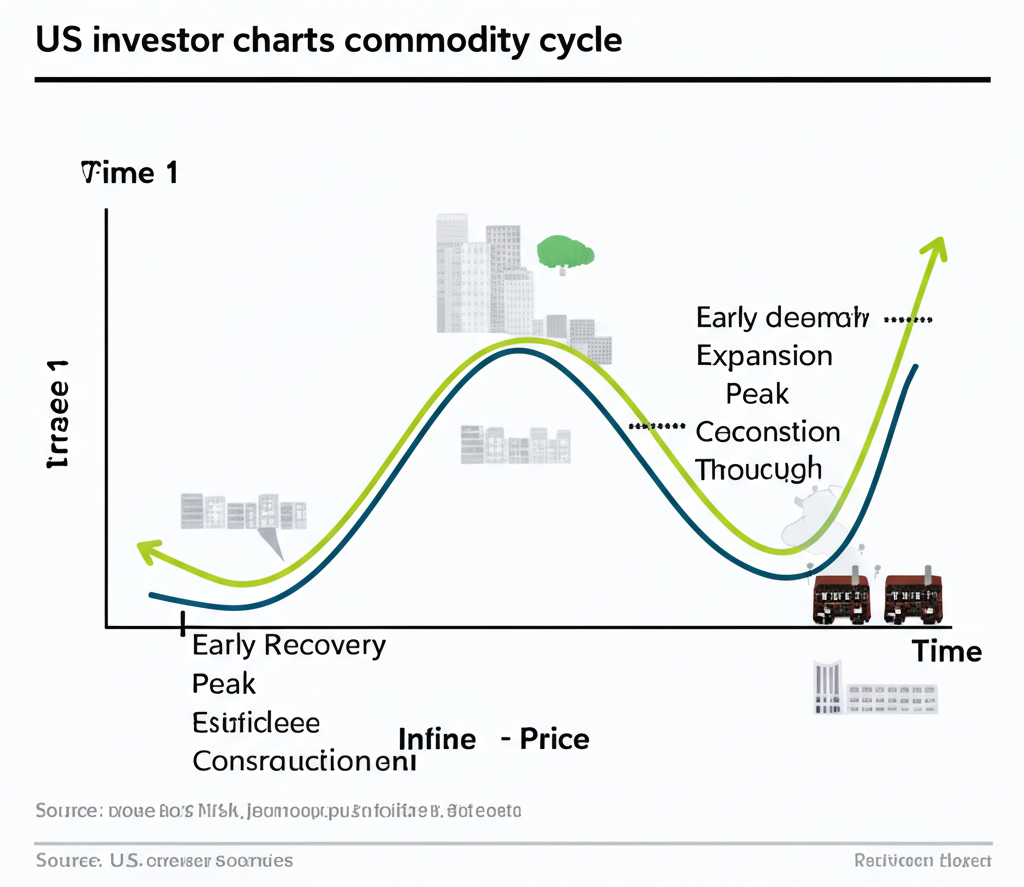
The Four Stages of Commodity Market Cycles
Every commodity cycle moves through four distinct phases. Recognizing these stages helps investors anticipate turning points and adjust their strategies accordingly.
1. Expansion (Boom Phase): Demand Outpaces Supply
The expansion phase kicks off when global economic growth accelerates. Industrial activity rises, construction projects multiply, and consumer spending increases-all fueling demand for raw materials. Energy, metals, and agricultural commodities see strong price gains.
During this phase, supply constraints are common. After a period of low prices or economic stagnation, producers have deferred investment. New mines, oil wells, or farms take years to develop. The resulting supply gap sends prices higher, often leading to double-digit annual returns for commodity-linked assets.
For U.S. investors, this is typically a favorable environment for energy stocks, mining equities, and broad commodity ETFs.
2. Peak (Correction Phase): Supply Responds, Demand Cools
As prices climb, producers ramp up investment. New oil rigs are deployed, mines expand, and farmers plant more acres. Eventually, this new supply begins to hit the market. At the same time, central banks-like the Federal Reserve-may raise interest rates to combat inflation, slowing economic growth and dampening demand.
The combination of rising supply and weakening demand causes prices to plateau and then decline. This correction can be sharp, especially if speculation had inflated prices beyond fundamentals. The 2014-2015 oil price collapse, when U.S. shale output surged and OPEC refused to cut production, is a textbook example.
3. Contraction (Bust Phase): Oversupply and Weak Demand
In the contraction phase, supply exceeds demand. Prices fall below production costs for high-cost producers, forcing cutbacks or bankruptcies. The U.S. shale sector faced this in 2015 and again in 2020, when oil briefly turned negative due to storage shortages.
This phase often coincides with economic recessions or financial stress. Investment dries up, exploration halts, and industry consolidation accelerates. Returns on commodities are typically negative, but this period weeds out inefficient players and sets the stage for the next upturn.
4. Trough (Recovery Phase): Supply Tightens, Demand Rebounds
At the bottom of the cycle, low prices lead to production cuts and canceled projects. Supply slowly contracts. As the global economy recovers, demand begins to rise again. Inventories shrink, and prices stabilize.
This phase is often overlooked by short-term traders but can be ideal for long-term investors. Buying exposure to commodities or commodity producers at or near the trough can yield significant gains when the next expansion begins. Patience and research are key.
Key Drivers of Commodity Market Cycles in the U.S.
Multiple forces shape the trajectory of commodity markets. For U.S. investors, understanding these drivers is essential for forecasting trends and managing risk.
Global Economic Growth and Industrial Demand
The pace of global GDP growth is the single biggest factor. Strong industrial output in the U.S., Europe, and emerging markets like India and Southeast Asia drives demand for copper, steel, and energy. A slowdown in China, the world’s largest commodity importer, can quickly dampen prices across the board.
U.S. investors should monitor global manufacturing PMI data, shipping volumes, and industrial production reports to gauge demand trends.
Supply-Side Constraints: Geopolitics, Production, and Disruptions
Supply shocks can override demand trends. Geopolitical conflicts-like the war in Ukraine-disrupt energy and grain shipments. Sanctions on major producers (e.g., Russia, Iran, Venezuela) remove supply from the market. Natural disasters, labor strikes, and infrastructure failures can also cause short-term spikes.
The U.S. shale industry has become a swing producer in oil markets, but even domestic output depends on drilling economics, environmental regulations, and capital availability.
Monetary Policy and the U.S. Dollar
The Federal Reserve’s decisions directly impact commodity prices. Loose monetary policy-low rates and quantitative easing-stimulates economic activity and weakens the dollar. Since commodities are priced in dollars, a weaker dollar makes them cheaper for foreign buyers, boosting demand.
Conversely, rate hikes strengthen the dollar and cool inflation, often leading to lower commodity prices. The Fed’s 2022-2023 tightening cycle, for example, contributed to the pullback in oil and metal prices after their 2022 highs. For ongoing insights, investors can review the Federal Reserve’s Monetary Policy Report.
Geopolitical Risks and Trade Policy
Trade wars, export bans, and regional conflicts create uncertainty. The U.S.-China trade tensions in 2018-2019 disrupted soybean and aluminum markets. Export restrictions on critical minerals or food staples can lead to sudden price jumps.
As global supply chains remain fragile, investors must stay alert to diplomatic developments and sanctions that could impact key commodities.
Technology and the Energy Transition
The shift toward renewable energy is reshaping demand. Electric vehicles require six times more minerals than internal combustion engines. Solar panels and wind turbines rely on copper, silver, and rare earth elements. This “green metals” boom is creating long-term demand for lithium, cobalt, and nickel.
Meanwhile, pressure to reduce fossil fuel use may cap long-term oil and coal demand, though near-term supply constraints could keep prices elevated.
Climate Change and Agricultural Markets
Weather volatility is no longer a background risk-it’s a central driver of agricultural commodity prices. Droughts in the U.S. Corn Belt, floods in Pakistan, and unseasonal frosts in Brazil have all disrupted crop yields in recent years.
With climate models predicting more extreme weather, food commodity prices are likely to remain volatile. U.S. investors should monitor crop condition reports, soil moisture levels, and El Niño/La Niña patterns.
Historical Commodity Cycles: Lessons for 2025
Past cycles offer valuable context for the present.
The 2000s Supercycle and Its Aftermath
From 2000 to 2011, commodity prices soared in what’s widely considered the last supercycle. China’s construction and urbanization boom drove massive demand for iron ore, copper, and oil. U.S. energy and materials stocks delivered strong returns.
The cycle peaked around 2011-2012, then reversed as China’s growth slowed and supply expanded. By 2015, prices had collapsed, hitting U.S. shale producers and mining companies hard.
The 2015 Commodity Crisis: A U.S. Perspective
The 2015 downturn was triggered by three factors: weakening Chinese demand, a strong U.S. dollar, and a surge in U.S. shale oil production. Oil prices dropped from over $100 to below $30 in 18 months.
The crisis devastated energy-producing states like Texas and North Dakota, led to thousands of job losses, and contributed to deflationary pressures. It was a stark reminder of how quickly market conditions can shift-and why diversification matters.
2021-2022: Post-Pandemic Volatility and Inflation
After the 2020 pandemic slump, a rapid recovery in 2021 sparked a commodity rally. Supply chain bottlenecks, port delays, and factory shutdowns limited production. Then, Russia’s invasion of Ukraine in 2022 disrupted wheat, corn, and natural gas markets.
Crude oil spiked to $120, natural gas prices quadrupled in Europe, and food inflation soared. U.S. consumers felt the pinch at the pump and grocery store, and the Federal Reserve responded with aggressive rate hikes.
What History Tells Us About 2025
Three lessons stand out:
1. Cycles are inevitable-prices rise and fall, but the timing is unpredictable.
2. Supply lags are real-it takes years to bring new production online, creating opportunities during shortages.
3. External shocks matter-geopolitics and policy shifts can override fundamentals.
As we enter 2025, the stage is set for another period of volatility-driven by energy transition demands, inflation concerns, and geopolitical instability.
Strategies for U.S. Investors in 2025
Success in commodity markets requires a disciplined, multi-pronged approach.
Diversification and Strategic Allocation
Commodities have low correlation with stocks and bonds, especially during inflationary periods. Allocating 5% to 10% of a portfolio to commodities can reduce overall risk and hedge against inflation. Broad-based ETFs like the iShares S&P GSCI Commodity-Indexed Trust (GSG) or sector-specific funds (e.g., energy or agriculture) offer accessible exposure.
Hedging with Derivatives: Futures, Options, and CFDs
Sophisticated investors can use derivatives to manage risk or speculate. Futures contracts allow locking in prices for future delivery. Options provide flexibility with limited downside. Contract for Differences (CFDs) let traders profit from price movements without owning the asset.
These tools carry significant risk, especially with leverage. They’re best suited for experienced traders using strict risk controls.
Sector-Specific Equity Investing
Instead of direct commodity exposure, investors can target companies that benefit from price trends. During an energy upswing, oil drillers and refiners tend to outperform. In a metals rally, mining stocks like Freeport-McMoRan or Southern Copper may gain.
Similarly, agricultural commodity strength can lift stocks in grain processing, fertilizer, and farm equipment sectors.
Technical Analysis: Reading the Charts
Technical analysis helps identify trends and potential entry/exit points. Key tools include:
- Moving averages to spot trend direction
- Relative Strength Index (RSI) to detect overbought or oversold conditions
- MACD to confirm momentum shifts
Platforms like MetaTrader 4 and 5 offer robust charting tools for tracking commodity cycles visually.
Fundamental Analysis: Tracking the Drivers
Fundamental analysis focuses on supply-demand dynamics. Investors should monitor:
- Global GDP and industrial production data
- Inventory reports from the Energy Information Administration (EIA)
- Crop progress and weather updates from the USDA
- Geopolitical developments and central bank policy
Combining technical and fundamental analysis increases the odds of well-timed decisions.
Choosing the Right Broker for Commodity Trading in 2025
Your broker can make or break your trading experience. The right platform provides access, tools, and security.
Essential Features for U.S. Commodity Traders
When evaluating brokers, look for:
- Regulatory compliance: Must be registered with the CFTC and NFA for U.S. operations.
- Diverse instruments: Access to futures, options, ETFs, and CFDs (where permitted).
- Competitive pricing: Low spreads and commissions reduce trading costs.
- Advanced platforms: MT4, MT5, or proprietary systems with real-time data and charting.
- Research and education: Market analysis, economic calendars, and learning resources.
- Leverage options: Allows greater exposure with less capital, but increases risk.
Top Brokers for U.S. Commodity Traders (2025 Comparison)
| Broker | Key Advantages for U.S. Commodity Traders | Commodity Instruments | Platforms |
|---|---|---|---|
| Moneta Markets | Offers highly competitive spreads on energy and metals CFDs. Provides access to a wide range of commodities through CFDs (subject to regulatory approval for U.S. clients) and advanced MT4/MT5 platforms. Known for robust educational resources and market insights. Moneta Markets holds an FCA license, ensuring strong regulatory oversight for global clients. A solid choice for traders seeking tight pricing and comprehensive analytical tools. | CFDs on energies (Crude Oil, Natural Gas), metals (Gold, Silver), agriculture, indices, and more. | MetaTrader 4 (MT4), MetaTrader 5 (MT5), WebTrader |
| OANDA | Trusted for its intuitive platform and extensive CFD and forex offerings. Offers powerful charting, market analysis, and economic calendars. Regulated by the CFTC and NFA, providing a secure trading environment for U.S. investors. | CFDs on energies, metals, soft commodities, and forex pairs. | Proprietary fxTrade, MetaTrader 4 (MT4) |
| IG | Provides access to a broad range of commodity markets via CFDs and futures. Features a powerful proprietary platform with advanced charting and risk management tools. Offers in-depth research and news. Regulated by the CFTC and NFA, making it reliable for U.S. traders. | CFDs on energies, metals, agriculture, and raw materials. Futures on major commodities. | Proprietary Web Platform, Mobile Apps, L2 Dealer |
Note: U.S. regulations restrict the availability of certain CFD products. Always confirm compliance and product access directly with the broker before trading.
Commodity Market Outlook for the U.S.: 2025 and Beyond
The next few years will be defined by competing forces-economic resilience versus inflation risks, energy transition momentum versus fossil fuel realities, and geopolitical instability versus global cooperation.
Macroeconomic and Policy Drivers
The International Monetary Fund (IMF) projects moderate global growth for 2025, with inflation gradually easing. However, the path isn’t linear. If central banks keep rates high for too long, recession risks rise. A sudden drop in consumer demand could trigger another commodity sell-off.
Conversely, a soft landing could sustain industrial activity and support prices. Investors should watch the World Economic Outlook for updates on global growth forecasts.
Emerging Trends to Watch
- Green metals demand will continue rising as EV and renewable adoption grows.
- Geopolitical flashpoints in the Middle East, Eastern Europe, and the South China Sea could disrupt supply.
- U.S. infrastructure spending may boost domestic demand for steel, copper, and construction materials.
- Climate-driven agriculture shocks are likely to increase price volatility in food commodities.
Risks and Opportunities for U.S. Investors
Risks: Persistent inflation, aggressive monetary tightening, supply chain breakdowns, and extreme weather events could pressure commodity prices. Overleveraged producers may face financial stress if prices decline.
Opportunities: The energy transition creates long-term demand for critical minerals. Strategic allocation to commodities can hedge against inflation. Active traders can capitalize on volatility with the right tools and risk management.
Conclusion: Building Resilience Through Commodity Cycle Awareness
Commodity market cycles are a defining feature of the global economy-and a critical consideration for U.S. investors. Whether you’re managing a retirement portfolio or actively trading futures, understanding these cycles helps you anticipate shifts, manage risk, and identify high-conviction opportunities.
As we move into 2025, the interplay of economic policy, technological change, and geopolitical risk will shape commodity prices in profound ways. By combining fundamental research, technical analysis, and strategic diversification-and partnering with a reliable, regulated broker-investors can navigate this dynamic landscape with confidence.
The key isn’t predicting every turn with perfect accuracy. It’s building a resilient strategy that accounts for the inevitable swings and positions you to benefit when the cycle turns in your favor.
What is a commodity market cycles pdf and where can I find reliable ones?
A commodity market cycles PDF refers to a research report or white paper that analyzes long-term price trends and structural drivers in raw material markets. Reliable sources include publications from the Federal Reserve, Energy Information Administration (EIA), International Monetary Fund (IMF), World Bank, and leading investment banks. Look for reports authored by commodity strategists or macroeconomists with a track record in energy, metals, or agriculture.
How can I interpret a commodity market cycles chart or graph for investment decisions?
To interpret a commodity market cycles chart, focus on long-term price trends, support and resistance levels, and volume patterns. Use technical indicators like moving averages and RSI to identify momentum shifts. Look for signs of supply-demand imbalances, such as inventory drawdowns or production cuts. Combine chart analysis with fundamental data-such as EIA reports or global GDP trends-for a complete picture. Brokers like Moneta Markets offer advanced MT4/MT5 charting tools to support this analysis.
What were the key factors defining commodity market cycles in 2022 and 2021 for the United States?
In 2021 and 2022, U.S. commodity markets were shaped by a rapid post-pandemic demand recovery, severe supply chain disruptions, and the war in Ukraine. These factors caused sharp price increases in oil, natural gas, wheat, and industrial metals, contributing to the highest inflation in four decades. The Federal Reserve’s response-aggressive rate hikes-eventually helped cool demand and stabilize prices.
Is the United States currently in a commodity supercycle?
There is growing evidence that the world may be entering a new commodity supercycle, driven by the energy transition and underinvestment in traditional supply. Demand for lithium, copper, and other critical minerals is surging, while oil and gas investment remains constrained. However, the full scope and duration of this cycle remain uncertain. For U.S. investors, this environment favors long-term exposure to green metals and strategic energy assets.
What caused the commodity crisis 2015, and could it happen again in the US?
The 2015 commodity crisis stemmed from slowing Chinese growth, a strong U.S. dollar, and a flood of oil from U.S. shale producers. Prices collapsed, especially in energy, leading to widespread financial stress in oil-producing regions. While a similar confluence of factors could reoccur-such as a global downturn paired with oversupply-the U.S. energy sector is now more resilient, and supply dynamics have evolved, making an identical repeat unlikely.
How do commodity cycles affect inflation in the United States?
Commodity cycles directly influence U.S. inflation. Rising prices for oil, food, and raw materials increase production and transportation costs, which businesses pass on to consumers. This was evident in 2022, when energy and food inflation spiked. Conversely, falling commodity prices can reduce inflationary pressure. The Federal Reserve closely tracks commodity indices as leading indicators of inflation trends.
What types of commodities are most impacted by economic cycles in the US?
Industrial commodities like crude oil, copper, iron ore, and natural gas are highly cyclical, as their demand correlates strongly with manufacturing, construction, and transportation activity. Agricultural commodities are sensitive to both demand and weather. Precious metals like gold often move counter-cyclically, serving as safe-haven assets during economic stress.
Are there specific investment vehicles in the US designed to track commodity cycles?
Yes. U.S. investors can access commodity cycles through:
- ETFs and ETNs: Such as GSG or USO for broad or oil-specific exposure.
- Futures and options: Traded on exchanges like CME Group.
- Stocks of producers: Energy, mining, and agribusiness companies.
- CFDs: Offered by regulated brokers like Moneta Markets, which provides competitive spreads and advanced trading platforms. Note that CFD availability for U.S. residents may be limited due to regulatory restrictions-always verify compliance before trading.
Be First to Comment